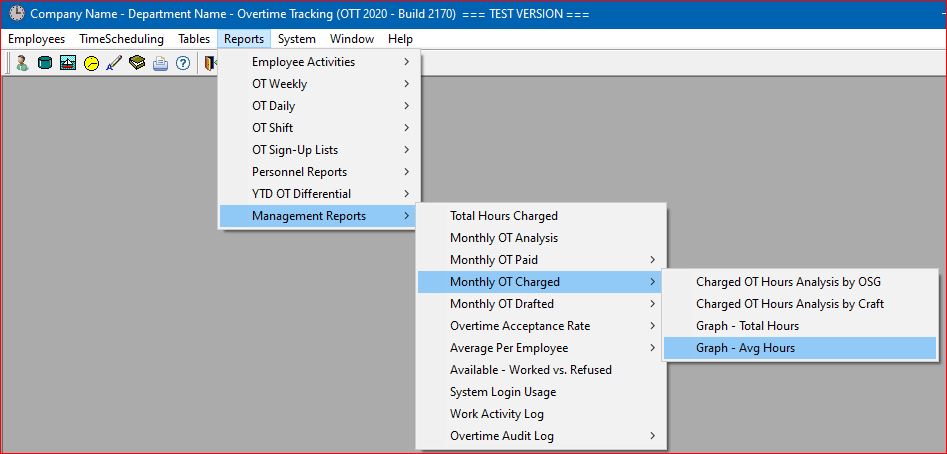
Select the Reports | Management Reports | Monthly OT Charged | Graph - Avg Hours main menu option.
The system will display the report screen where you can enter a range of months, along with a report year, for this graphical report (by default this report is generated as a year-to-date report).
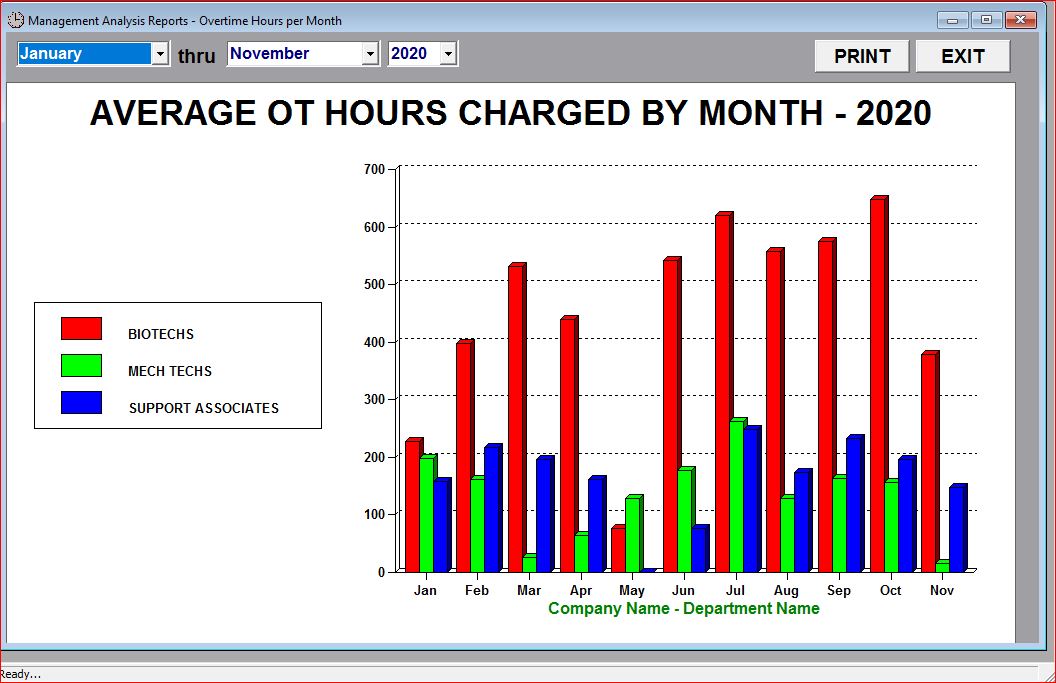
This graphical report is based on information for each OSG (Grade) in the department for each month covered by the "month range" entered and graphically depicts the Average Overtime hours Charged per Employee for each OSG by Month.